Cases by Age over Time
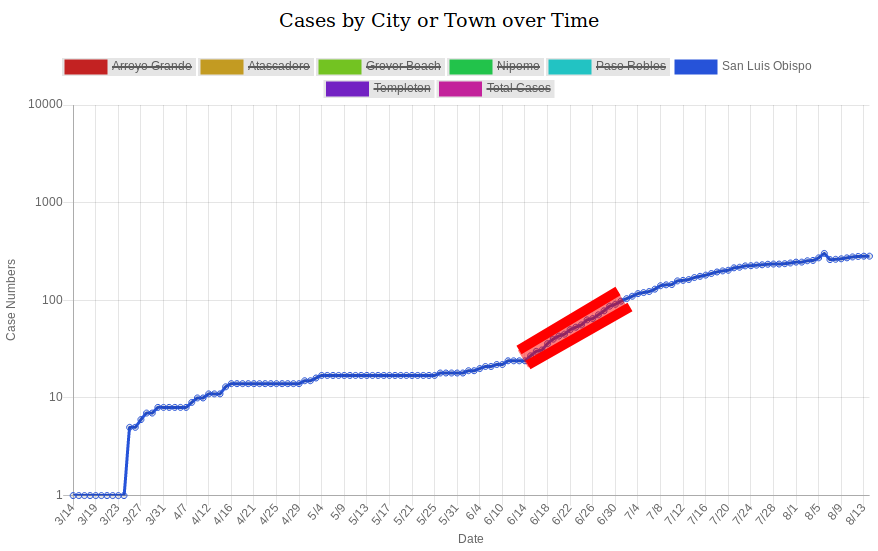
Cases by City or Town over Time
Note: Less total cases are reported here than by age because these locations do not cover the whole county.
Note: emergencyslo has a reporting error for CMC Inmates on 8/26
With Cal Poly set to reopen "de-densified" in the Fall, it is important to have easily understandable data on the ongoing pandemic within SLO county.
Without intervention, viruses spread exponentially. Exponential growth of a disease can quickly overwhelm healthcare institutions. The logarithmic graphs shown above can better illustrate whether the growth rate of COVID-19 is exponential or not.
A straight steep line on a logarithmic scale reveals fast exponential growth, but a downward curve or a flat line reveals a slower growth rate. The graph of COVID-19 cases often switches between the two. For instance, the cases in San Luis Obispo were exponentially growing in mid-June and thus the logarithmic graph of those cases has a roughly straight line during that time. That concept is highlighted in the graph below:
Since social distancing affects the growth rate of the coronavirus, a logarithmic graph can sometimes indicate how well or how poorly a population has been social distancing. This allows for a better understanding on the impact certain events and policies have on the growth of COVID-19.
This website is designed to supplement the graphs on the emergencyslo website to include an option for seeing important data in a logarithmic scale. All case data used here is sourced from that website and hosted by The Office of Emergency Services in SLO County. This website is in no way affiliated with or a representative of The Office of Emergency Services in SLO County, nor is it affiliated with any other governmental entity.